The Cusum method
This is an explanation of the cusum chart, its properties, and how to calculate it.We begin with the idea that each week (or each month), we will:
- measure the actual quantity of fuel, electricity, water or other consumable resource which has been used for a particular process or duty; and
- calculate the expected or 'target' quantity (using any viable method, not necessarily a straight-line model)
- compare the two, to arrive at a figure for the difference between actual and expected quantity

|
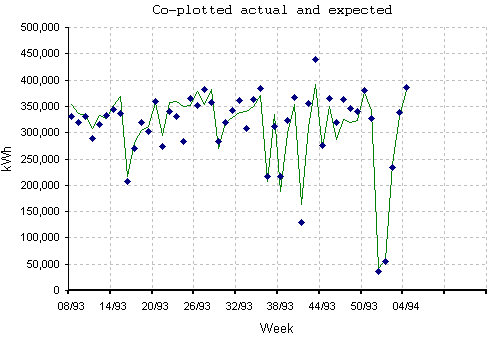
Figure 1 This graph shows, for one of our sample data sets, how the actual consumption (blue blobs) relates to the expected consumption (green line). As one might expect, the traces are similar but not exactly identical. |

|
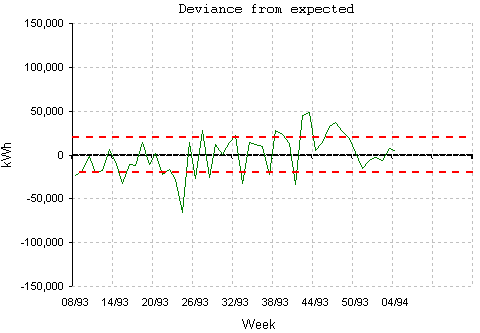
Figure 2 Next we can concentrate on the differences in successive weeks (or months). This is called the deviance chart or control chart. |

|
Figure 3 To clarify any underlying pattern in the deviance chart (Fig 2), we calculate the cumulative sum of the deviances. This is the cusum chart. It has a number of useful properties:
|
A very useful analogy is to think of the cusum chart in terms of a history of your bank balance. If your balance stays more or less steady (regardless of how much you have in the bank) you know that you are successfully balancing your income and outgoings. Now anything which upsets the situation, such as a loss of overtime pay, will cause your balance to start declining until such time as you make an adjustment (a new job, or an economy drive) to restore equilibrium. However, merely restoring equilibrium does not restore your bank balance; it merely stabilises it at a new level.