Software for energy monitoring and targeting
There are numerous products on the market under the label 'monitoring and targeting' but if you want to use the software for active waste avoidance there are two particular attributes to look for:- "Overspend league table" reporting
- The software must be able to display the costs of deviations from expected consumption for each monitored stream, ranked in descending order. This will give you a quick hit-list of exceptions. It requires no specialist M&T or energy knowledge to interpret this report, nor to follow up any significant overspends, since conventional enquiries should yield clues about what has caused the problems.
- Selective regression analysis and cusum charting
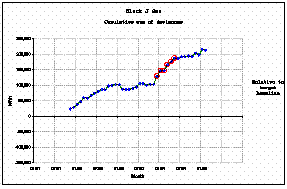
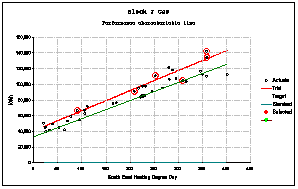
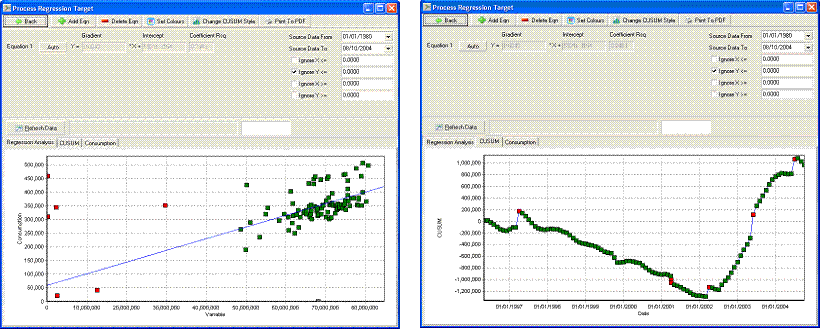
- Many products treat a regression line as a passive output, merely displaying the estimated relationship between consumption and its main driving factor. Better software integrates regression analysis into the target-setting process but for best results one needs to be able to validate targets by reference to the resulting cusum chart. The procedure becomes iterative and it is a great help to be able to (a) select points in any chart at will by clicking on them; (b) switch rapidly between the cusum and scatter diagram view and see the same selected points marked; (c) request a regression analysis of selected points only.


NIFES "XSDplot" screen shots

Optima screen shots

Team Sigma screen shot