Relating energy demand
to degree days
The first step in analysing your building's performance is
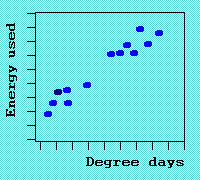
to record, on a scatter diagram, the past monthly
energy consumption (on the vertical axis) against the
corresponding degree days (horizontal axis).Note: if instead of monthly data you have weekly meter readings (and degree days to match), better still.
You would normally expect to see a diagonal relationship between the two, which you can then draw in as a straight line.

Forward