Figure 1: 24-hour demand profiles in a warehouse
Advances in metering, communications and computer technology have made it easier (and more affordable) for energy users to monitor their energy consumption at intervals of half an hour or less, and to view the results graphically. The long- established idea of automatic meter reading (AMR) has evolved – it is claimed -- into automatic monitoring and targeting (AM&T) .
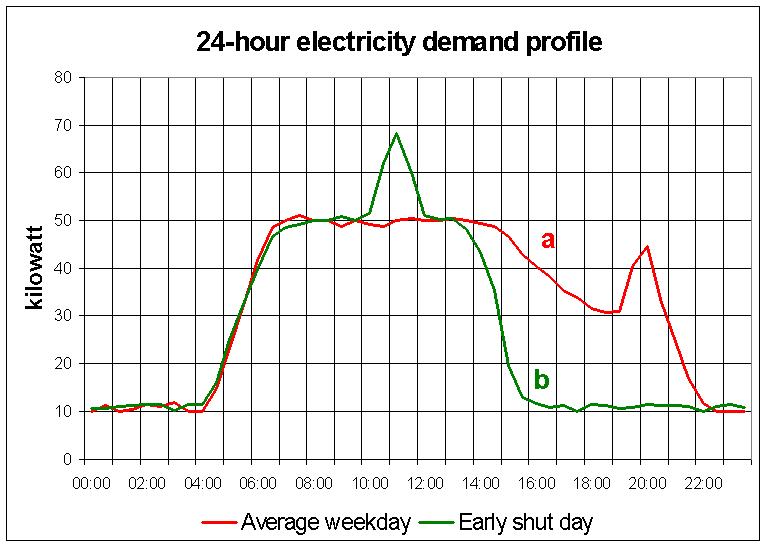
Figure 1: 24-hour demand profiles in a warehouse
Figure 1 shows how helpful it can be to have this fine-grained data. The two traces show (a) an average weekday's electricity demand profile and (b) an exceptional day when the building (a warehouse) closed early. A curious spike is apparent towards the end of the working period. On investigation it was found that the fork-lift truck drivers were putting them on to charge before they went home. They were supposed to be charged after midnight on cheap electricity; this was not happening. Worse still, the day they finished early, their action resulted in a record maximum demand (costly in itself) and an increase in the site's agreed supply capacity, which caused a permanent increase in their monthly bills. When challenged, the drivers claimed that they had to put the trucks on to charge before going home because otherwise they would not be fully recharged by the morning. The chart shows otherwise: just two hours after starting charging , consumption has fallen back to its underlying level.
This case illustrates "threshold-based targeting", which sets upper limits on peak (and sometimes out-of-hours) demand levels. A breach of either of these limits indicates possible energy waste.
Threshold-based targeting can be automated, but the method does not usually give any indication of the excess cost incurred, which makes it difficult to integrate into a cost-prioritised exception reporting regime. It must also be deployed with care if nuisance alarms are to be avoided.
Another form of assessment is termed "precedent-based" targeting and it works whenever there is a recurrent daily or weekly pattern of demand. Visual assessment can be laborious and inaccurate, so better monitoring and targeting schemes now include algorithms that automatically compare demand in real time against a "template" derived from similar days in the past.
Bearing in mind that in any given half-hour the consumption may be above or below template (because of loads coming and going at different times on different days), the intelligent way to use precedent-based targeting is to avoid the temptation to provide real-time alerts, but instead to aggregate the half-hourly deviations through (say) a 24 hour period and do the assessment daily. This largely solves the problem of spurious alerts being caused and unless the load is huge, the cost penalty of delaying the alert will not be significant.
It is also important, with precedent-based targeting, to flag up days that are unrepresentative, and to respond accordingly. This is illustrated in Figure 2, where Tuesday 24 December is flagged as a Friday and the subsequent seven days as Sundays. The targeting algorithm can then avoid using those days as precedents for later occurrences of the actual days of the week (although the 'virtual' Sundays might be useable for targeting future Sundays). Finally, days on which excess consumption is known to have occurred must be permanently excluded.
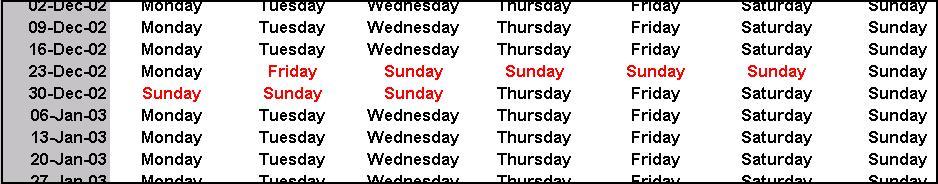
Figure 2: day-type substitution
This still leaves unresolved the question of demand profiles that do not have a strong recurrent pattern - an important category in view of the fact that much industrial energy consumption is either unpredictable and irregular, or else fairly continuous with occasional extended breaks. Figure 3 (a) shows a 2-week history of electricity demand in a 24-hour batch production facility. The data are presented as a contour plot to show that there is no recurrent weekly or daily pattern: each row represents one day, midnight to midnight.
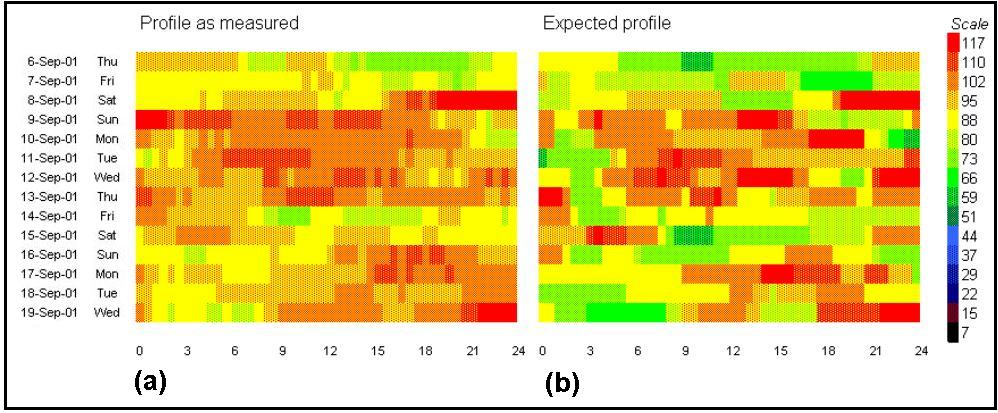
Figure 3: consumption profiles (a) as measured and (b) as predicted
To assess half-hourly consumption as such it is necessary to calculate expected consumption at the same interval. In fact that is what was done in this case: the manufacturing schedule was connected to a targeting model which then computed the likely demand in each half hour. This gave Figure 3 (b), which shows broadly similar features, suggesting that on the whole the plant was operated as intended without, for example, major items being allowed to run idle between batches.
This "activity-based" approach is what must be used if automatic monitoring and targeting is to be deployed where demand is irregular. Again, as with precedent- based targets, a high-frequency activity-based target runs the risk of generating nuisance alarms. In the example used here, the first line of defence was a weekly assessment of gains and losses. The pattern of expected demand was translated into weekly totals, against which weekly actual consumption was gauged. This approach integrates well with cost-prioritised exception reporting (as exemplified by the "overspend league table") and when significant cost variances are flagged up by the weekly review, the fine-grained data can be pulled out and examined for clues.
In another recent project I was asked to set up a scheme to monitor steam consumption in a set of distillation columns. These were being fed with acetic acid in an organic solvent, and the solvent was being boiled off. It was therefore possible to assess the efficiency of the process by measuring all the relevant flows and temperatures at intervals of a few minutes, calculating the implied latent and sensible heat requirement, and comparing the total with the energy supplied as steam. But in a process such as this - indeed in many processes - there are lags, latencies, and transients complicating the picture, making it meaningless to attempt real-time targeting. Again, weekly aggregation was used (although we now suspect that daily assessment would be safe) and the major benefit of the real-time data was that it allowed us to detect transient and off-load operation, and to filter the data and assess only steady on-load operation.
So one can begin to see that automatic meter reading has benefits beyond just the ability to visualise consumption patterns. Other benefits include the ability to read remote or inaccessible meters and - perhaps most important of all - to synchronise dozens or hundreds of meter readings at the end of each week, day or shift. The improved metering data must, however, be matched by improvements in the collection of driving-factor information and that can be quite a hard nut to crack, sometimes necessitating access to real-time weather data and status information from production processes. Unfortunately, unless both consumption and driving- factor data can be collected in a synchronised manner, the claims for automatic monitoring and targeting can ring hollow.